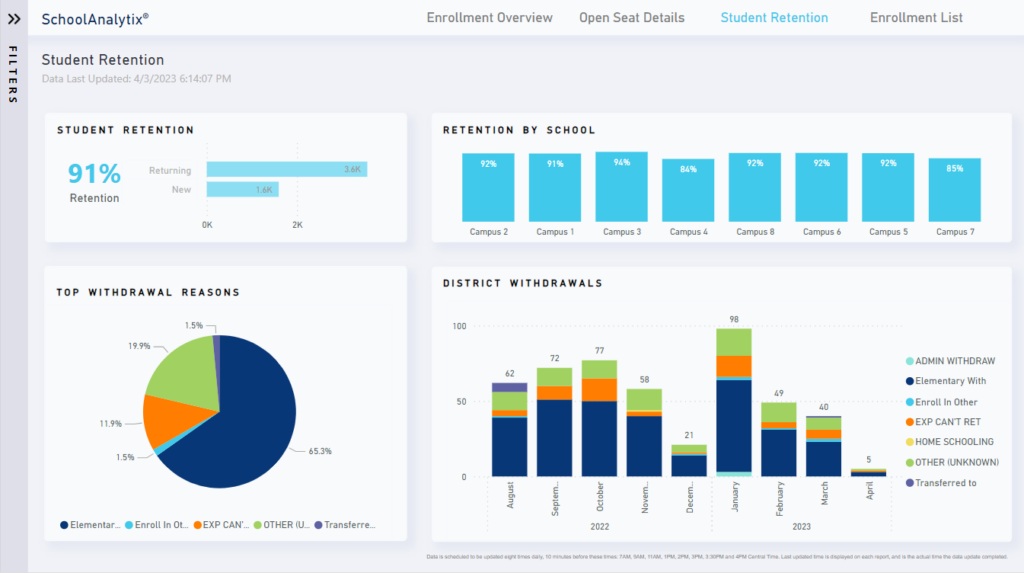
In today’s educational landscape, institutions are increasingly turning to data-driven approaches to enhance student success and retention. By harnessing the power of predictive analytics and visualization tools like Power BI, educators can gain valuable insights from Student Information System (SIS) data to identify at-risk students early, personalize interventions, and ultimately improve retention rates. This article delves into the process of building a predictive student success dashboard in Power BI, highlighting the steps involved and the benefits it offers for implementing enhanced retention strategies.
Understanding the Importance of Student Success and Retention: Student success and retention are crucial metrics for educational institutions, impacting not only the students’ academic journey but also the institution’s reputation and financial sustainability. High dropout rates not only result in lost tuition revenue but also hinder the institution’s ability to fulfill its mission of fostering student learning and achievement. Therefore, proactive measures to improve student success and retention are paramount.
The Role of Predictive Analytics in Student Retention: Predictive analytics plays a pivotal role in student retention efforts by enabling institutions to identify patterns and trends within SIS data that may indicate students at risk of dropping out or underperforming. By leveraging predictive modeling techniques, such as machine learning algorithms, institutions can forecast which students are most likely to encounter academic challenges or disengage from their studies, allowing for timely intervention and support.
Building a Predictive Student Success Dashboard in Power BI:
Data Collection and Integration:
- Gather relevant data from the institution’s SIS, including demographic information, academic records, attendance data, and engagement metrics.
- Integrate the collected data into Power BI using data connectors or ETL (Extract, Transform, Load) processes to create a unified dataset for analysis.
Data Preparation and Cleaning:
- Cleanse and preprocess the data to address any inconsistencies, missing values, or outliers that may affect the accuracy of the predictive models.
- Perform data transformations, such as feature engineering and scaling, to prepare the data for predictive analysis.
Feature Selection and Model Development:
- Identify key features or variables that correlate with student success and retention, such as GPA, course grades, attendance, and participation.
- Develop predictive models, such as logistic regression, decision trees, or neural networks, using historical data to predict student outcomes.
Dashboard Design and Visualization:
- Design a user-friendly dashboard interface in Power BI, incorporating interactive visualizations and data-driven insights.
- Include key metrics and KPIs related to student success and retention, such as retention rates, dropout rates, and predictive risk scores.
- Implement drill-down functionality and filters to allow users to explore data at various levels of granularity and customize their analysis.
Deployment and Integration:
- Deploy the predictive student success dashboard within the institution’s existing infrastructure, making it accessible to administrators, advisors, and faculty members.
- Integrate the dashboard with other institutional systems and workflows to streamline communication and collaboration around student retention efforts.
Benefits of a Predictive Student Success Dashboard:
- Early Identification of At-Risk Students: The dashboard enables early detection of students who may be struggling academically or at risk of dropping out, allowing for proactive intervention.
- Personalized Interventions: By analyzing individual student data, institutions can tailor interventions and support services to address specific needs and challenges.
- Resource Optimization: Institutions can allocate resources more effectively by targeting interventions towards students who are most in need of assistance, maximizing the impact of retention efforts.
- Continuous Improvement: The dashboard provides valuable insights into the effectiveness of retention strategies over time, allowing institutions to refine and optimize their approaches based on data-driven feedback.
Conclusion:
Building a predictive student success dashboard in Power BI empowers educational institutions to leverage SIS data for enhanced retention strategies. By adopting a data-driven approach to student success, institutions can proactively identify at-risk students, personalize interventions, and ultimately improve retention rates. As the educational landscape continues to evolve, the integration of predictive analytics and visualization tools will play an increasingly vital role in supporting student achievement and fostering a culture of success within institutions.
Leveraging SchoolAnalytix for Expert Guidance
While PowerBI offers powerful analytics capabilities, maximizing its potential for student retention requires expertise in data visualization, predictive modeling, and educational analytics. This is where SchoolAnalytix comes into play. As a leading provider of data analytics solutions for educational institutions, SchoolAnalytix offers a wealth of expertise and resources to support institutions in their quest to optimize student retention.
By partnering with SchoolAnalytix institutions gain access to a team of experienced data scientists, educators, and analysts who specialize in leveraging PowerBI for educational purposes. From dashboard design and customization to predictive modeling and intervention strategies,
SchoolAnalytix provides end-to-end support tailored to the unique needs and goals of each institution.

